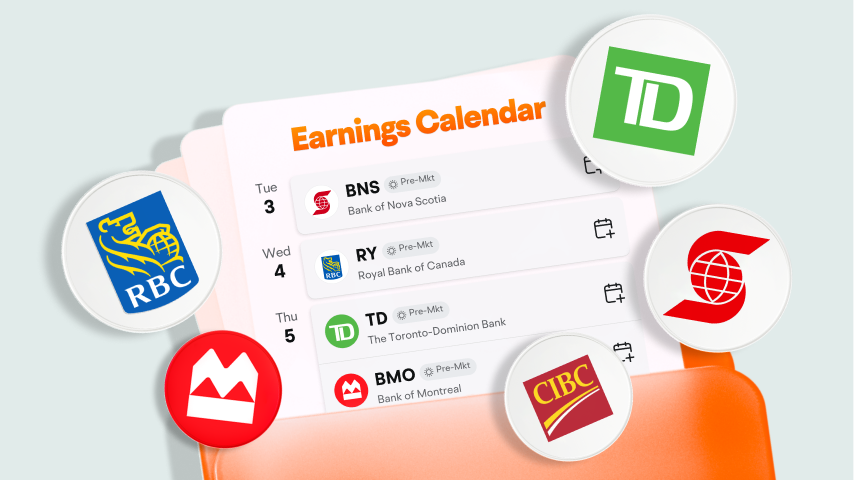
The Toronto-Dominion Bank
TD
Canadian Imperial Bank of Commerce
CM
Royal Bank of Canada
RY
Bank of Nova Scotia
BNS
Bank of Montreal
BMO
| (Q2)Jun 30, 2023 | (Q1)Mar 31, 2023 | (FY)Dec 31, 2022 | (Q4)Dec 31, 2022 | (Q3)Sep 30, 2022 | (Q2)Jun 30, 2022 | (Q1)Mar 31, 2022 | |
|---|---|---|---|---|---|---|---|
| Operating Cash Flow (Indirect Method) | |||||||
| Cash flow from continuing operating activities | -374.34%-91.95K | -115.16%-80.81K | -91.81K | -14.56K | -20.31K | -19.39K | -37.56K |
| Net income from continuing operations | -39.71%-57.99K | -303.77%-61.08K | ---139.06K | ---69.19K | ---13.24K | ---41.51K | ---15.13K |
| Remuneration paid in stock | ---- | ---- | --30.95K | --0 | --0 | ---- | ---- |
| Change In working capital | -251.54%-31.03K | 12.05%-19.73K | --16.31K | --54.63K | ---7.07K | ---8.83K | ---22.43K |
| -Change in receivables | -269.11%-3.53K | 117.87%2.66K | ---2.88K | ---2.54K | ---600 | ---955 | --1.22K |
| -Change in payables and accrued expense | -249.40%-27.51K | 5.34%-22.39K | --19.18K | --57.17K | ---6.47K | ---7.87K | ---23.65K |
| Cash from discontinued investing activities | |||||||
| Operating cash flow | -374.34%-91.95K | -115.16%-80.81K | ---91.81K | ---14.56K | ---20.31K | ---19.39K | ---37.56K |
| Investing cash flow | |||||||
| Cash flow from continuing investing activities | -180K | -25K | 0 | 0 | |||
| Net other investing changes | ---180K | ---25K | ---- | ---- | ---- | ---- | ---- |
| Cash from discontinued investing activities | |||||||
| Investing cash flow | ---180K | ---25K | ---- | ---- | ---- | --0 | --0 |
| Financing cash flow | |||||||
| Cash flow from continuing financing activities | 0 | 0 | 403.3K | 0 | 0 | 0 | 403.3K |
| Net common stock issuance | --0 | --0 | --465K | --0 | --0 | --0 | --465K |
| Net other financing activities | ---- | ---- | ---61.7K | --0 | --0 | --0 | ---61.7K |
| Cash from discontinued financing activities | |||||||
| Financing cash flow | --0 | --0 | --403.3K | --0 | --0 | --0 | --403.3K |
| Net cash flow | |||||||
| Beginning cash position | -24.41%495.75K | 107.39%601.55K | --290.06K | --616.11K | --636.42K | --655.8K | --290.06K |
| Current changes in cash | -1,302.89%-271.95K | -128.93%-105.81K | --311.49K | ---14.56K | ---20.31K | ---19.39K | --365.74K |
| End cash Position | -64.84%223.8K | -24.41%495.75K | --601.55K | --601.55K | --616.11K | --636.42K | --655.8K |
| Free cash from | -374.34%-91.95K | -115.16%-80.81K | ---91.81K | ---14.56K | ---20.31K | ---19.39K | ---37.56K |
| Accounting Standards | US-GAAP | US-GAAP | US-GAAP | US-GAAP | US-GAAP | US-GAAP | US-GAAP |
| Audit Opinions | -- | -- | Unqualified Opinion | -- | -- | -- | -- |
FY: Financial Year. Refers to the 10-K file disclosed by the listed company to the SEC.
Q: Quarter. Refers to the 10-Q file disclosed by the listed company to the SEC. Q1, Q2, Q3, and Q4 are quarterly reports each with a span of 3 months; Q6 and Q9 are cumulative reports, with Q6 including 6 months and Q9 9 months.
