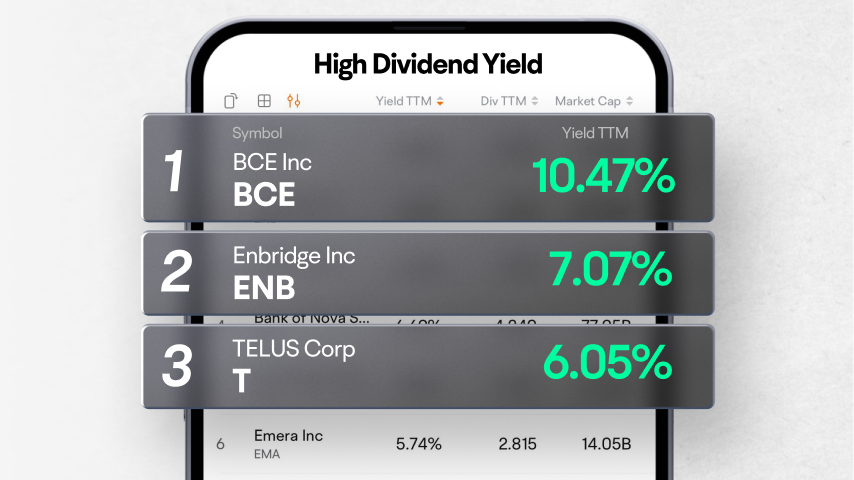
Enbridge Inc
ENB
Choice Properties Real Estate Investment Trust
CHP.UN
Brookfield Renewable Partners LP
BEP.UN
The Toronto-Dominion Bank
TD
TC Energy Corp
TRP
| (FY)Dec 31, 2022 | (Q4)Dec 31, 2022 | (Q3)Sep 30, 2022 | (Q2)Jun 30, 2022 | (Q1)Mar 31, 2022 | (FY)Dec 31, 2021 | (Q4)Dec 31, 2021 | (Q3)Sep 30, 2021 | (Q2)Jun 30, 2021 | (Q1)Mar 31, 2021 | |
|---|---|---|---|---|---|---|---|---|---|---|
| Operating Cash Flow (Indirect Method) | ||||||||||
| Cash flow from continuing operating activities | 510.50%3.99M | -125.25%-199K | 272.72%2.18M | 382.88%1.14M | 1,012.63%867K | -128.50%-971K | 16.91%788K | -181.88%-1.26M | -134.68%-403K | -211.76%-95K |
| Net income from continuing operations | -49.10%994K | -92.60%55K | -67.96%174K | 23.02%620K | -11.04%145K | 16.74%1.95M | 146.03%743K | -1.99%543K | -24.89%504K | 11.64%163K |
| Operating gains losses | 0.00%5K | --0 | --5K | ---- | ---- | -66.67%5K | --0 | ---- | ---- | --5K |
| Depreciation and amortization | -2.11%2.18M | -17.86%483K | -14.55%511K | 14.89%594K | 12.95%593K | 30.29%2.23M | 33.03%588K | 43.41%598K | 21.08%517K | 23.82%525K |
| Remuneration paid in stock | 118.52%118K | 129.41%39K | 166.67%32K | 84.62%24K | 91.67%23K | 20.00%54K | -15.00%17K | 0.00%12K | 85.71%13K | 100.00%12K |
| Deferred tax | 170.18%40K | 8.33%13K | 206.67%32K | 700.00%18K | 36.11%-23K | -67.65%-57K | -42.86%12K | -500.00%-30K | 82.35%-3K | -9.09%-36K |
| Change In working capital | 112.57%648K | -37.94%-789K | 159.73%1.42M | 91.91%-116K | 116.88%129K | -257,600.00%-5.15M | -415.32%-572K | -522.70%-2.38M | -2,615.79%-1.43M | -66.81%-764K |
| -Change in receivables | 135.64%876K | 218.37%312K | 204.42%1.28M | 61.01%-216K | 36.41%-496K | -548.55%-2.46M | -74.94%98K | -489.17%-1.22M | 11.50%-554K | -70.31%-780K |
| -Change in inventory | 81.48%-475K | 408.55%595K | 64.36%-216K | 116.25%226K | -57.66%-1.08M | -3,613.70%-2.57M | -12.03%117K | -559.09%-606K | -2,827.45%-1.39M | -262.43%-685K |
| -Change in prepaid assets | -1,533.33%-49K | -2.27%86K | -28.95%-196K | -55.06%40K | 175.00%21K | 96.39%-3K | 31.34%88K | -39.45%-152K | -26.45%89K | 82.72%-28K |
| -Change in payables and accrued expense | 143.22%51K | -131.01%-1.59M | 139.81%127K | -142.14%-185K | 276.77%1.7M | -115.73%-118K | -22.78%-690K | -171.85%-319K | -15.90%439K | 30.64%452K |
| -Change in other current assets | 200.00%23K | --23K | --0 | --0 | ---- | 45.24%-23K | --0 | --0 | ---23K | ---- |
| -Change in other working capital | 1,607.69%222K | -14.05%-211K | 609.41%433K | 216.67%19K | -106.86%-19K | 104.05%13K | -103.30%-185K | 62.05%-85K | 154.55%6K | 5,440.00%277K |
| Cash from discontinued investing activities | ||||||||||
| Operating cash flow | 510.50%3.99M | -125.25%-199K | 272.72%2.18M | 382.88%1.14M | 1,012.63%867K | -128.50%-971K | 27.10%788K | -181.88%-1.26M | -134.68%-403K | -211.76%-95K |
| Investing cash flow | ||||||||||
| Cash flow from continuing investing activities | 76.52%-752K | -11.35%-157K | -293.51%-303K | 93.99%-166K | 43.50%-126K | -390.51%-3.2M | -78.48%-141K | 82.58%-77K | -5,904.35%-2.76M | -159.30%-223K |
| Net PPE purchase and sale | 39.53%-312K | 18.68%-74K | -238.24%-115K | 77.42%-70K | 34.57%-53K | -9.79%-516K | -468.75%-91K | 91.21%-34K | -1,376.19%-310K | -76.09%-81K |
| Net intangibles purchas and sale | 83.62%-440K | -66.00%-83K | -337.21%-188K | 96.08%-96K | 48.59%-73K | -1,368.31%-2.69M | 20.63%-50K | 21.82%-43K | -9,708.00%-2.45M | -255.00%-142K |
| Cash from discontinued investing activities | ||||||||||
| Investing cash flow | 76.52%-752K | -11.35%-157K | -293.51%-303K | 93.99%-166K | 43.50%-126K | -390.51%-3.2M | -78.48%-141K | 82.58%-77K | -5,904.35%-2.76M | -159.30%-223K |
| Financing cash flow | ||||||||||
| Cash flow from continuing financing activities | -206.49%-3.31M | 134.21%183K | -255.09%-1.93M | -133.24%-1M | 9.55%-559K | 303.87%3.11M | -162.25%-535K | 452.26%1.25M | 375.53%3.02M | -586.61%-618K |
| Net issuance payments of debt | -175.04%-2.73M | 131.83%183K | -232.93%-1.63M | -133.37%-1.01M | -965.38%-277K | 490.34%3.64M | -176.44%-575K | 439.89%1.23M | 375.07%3.01M | -103.55%-26K |
| Net common stock issuance | -61.25%31K | --0 | -80.00%4K | -60.00%2K | 66.67%25K | 627.27%80K | 900.00%40K | 185.71%20K | --5K | --15K |
| Cash dividends paid | -1.15%-614K | --0 | ---307K | --0 | 49.42%-307K | -0.33%-607K | --0 | --0 | --0 | -0.33%-607K |
| Cash from discontinued financing activities | ||||||||||
| Financing cash flow | -206.49%-3.31M | 134.21%183K | -255.09%-1.93M | -133.24%-1M | 9.55%-559K | 303.87%3.11M | -162.25%-535K | 452.26%1.25M | 375.53%3.02M | -586.61%-618K |
| Net cash flow | ||||||||||
| Beginning cash position | -76.59%325K | 96.71%419K | 57.24%478K | 12.17%507K | -76.59%325K | 767.50%1.39M | -79.73%213K | -0.98%304K | 58.04%452K | 767.50%1.39M |
| Current changes in cash | 92.57%-79K | -254.46%-173K | 35.16%-59K | 80.41%-29K | 119.44%182K | -186.56%-1.06M | -66.77%112K | -112.23%-91K | -804.76%-148K | -842.86%-936K |
| End cash Position | -24.31%246K | -24.31%246K | 96.71%419K | 57.24%478K | 12.17%507K | -76.59%325K | -76.59%325K | -79.73%213K | -0.98%304K | 58.04%452K |
| Free cash from | 177.48%3.23M | -155.02%-356K | 240.13%1.88M | 130.77%974K | 333.02%741K | -251.56%-4.17M | 19.59%647K | -221.86%-1.34M | -383.60%-3.17M | -31,700.00%-318K |
| Accounting Standards | US-GAAP | US-GAAP | US-GAAP | US-GAAP | US-GAAP | US-GAAP | US-GAAP | US-GAAP | US-GAAP | US-GAAP |
| Audit Opinions | Unqualified Opinion | -- | -- | -- | -- | Unqualified Opinion | -- | -- | -- | -- |
FY: Financial Year. Refers to the 10-K file disclosed by the listed company to the SEC.
Q: Quarter. Refers to the 10-Q file disclosed by the listed company to the SEC. Q1, Q2, Q3, and Q4 are quarterly reports each with a span of 3 months; Q6 and Q9 are cumulative reports, with Q6 including 6 months and Q9 9 months.
