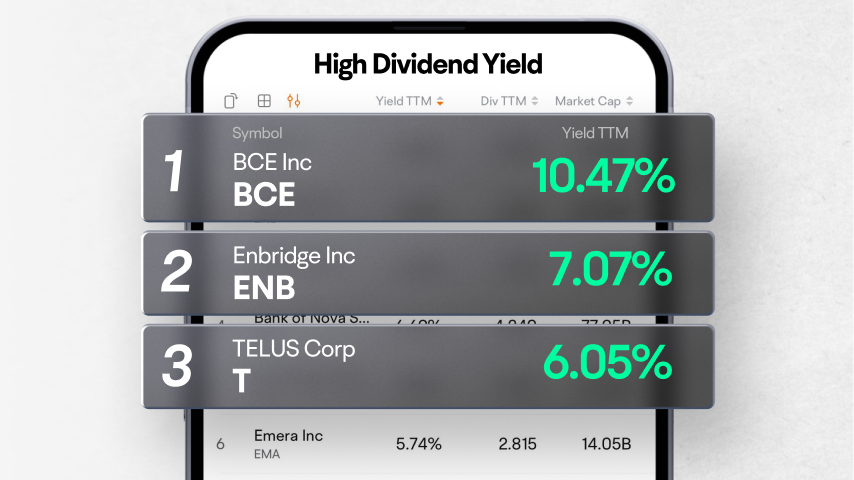
Bank of Nova Scotia
BNS
TC Energy Corp
TRP
Emera Inc
EMA
Choice Properties Real Estate Investment Trust
CHP.UN
Power Corporation of Canada
POW
| (Q2)May 31, 2024 | (FY)Nov 30, 2023 | (Q4)Nov 30, 2023 | (Q2)May 31, 2023 | (FY)Nov 30, 2022 | (Q4)Nov 30, 2022 | (Q2)May 31, 2022 | (FY)Nov 30, 2021 | (Q4)Nov 30, 2021 | (Q2)May 31, 2021 | |
|---|---|---|---|---|---|---|---|---|---|---|
| Assets | ||||||||||
| Cash, cash equivalents and federal funds sold | -34.65%226.33M | 3.14%295.39M | 3.14%295.39M | 94.00%346.36M | 90.20%286.41M | 90.20%286.41M | 43.19%178.53M | 43.18%150.59M | 43.18%150.59M | 4,520.96%124.68M |
| -Cash and cash equivalents | -34.65%226.33M | 3.14%295.39M | 3.14%295.39M | 94.00%346.36M | 90.20%286.41M | 90.20%286.41M | 43.19%178.53M | 43.18%150.59M | 43.18%150.59M | 4,520.96%124.68M |
| -Available for sale securities | 17.19%1.65B | 3.48%1.5B | 3.48%1.5B | -7.87%1.41B | 0.81%1.45B | 0.81%1.45B | 28.64%1.53B | 79.60%1.43B | 79.60%1.43B | 1,391.72%1.19B |
| Receivables | 158.25%12.68M | 41.84%6.09M | 41.84%6.09M | 12.29%4.91M | 1.70%4.3M | 1.70%4.3M | 35.44%4.37M | 53.86%4.22M | 53.86%4.22M | --3.23M |
| Total assets | 7.39%1.89B | 3.52%1.8B | 3.52%1.8B | 2.79%1.76B | 9.28%1.74B | 9.28%1.74B | 30.04%1.72B | 75.30%1.59B | 75.30%1.59B | 64.60%1.32B |
| Liabilities | ||||||||||
| Derivative product liabilities | 491.46%3.19M | -10.72%4.69M | -10.72%4.69M | -82.04%539.82K | 570.17%5.25M | 570.17%5.25M | -4.51%3.01M | -81.96%783.91K | -81.96%783.91K | -55.86%3.15M |
| Payables | 10.52%20.64M | 70.19%43.48M | 70.19%43.48M | 21.80%18.68M | 67.03%25.55M | 67.03%25.55M | 21.14%15.33M | 42.12%15.3M | 42.12%15.3M | 101.81%12.66M |
| -Accounts payable | 19.18%20.64M | 73.95%42.19M | 73.95%42.19M | 23.30%17.32M | 82.59%24.25M | 82.59%24.25M | 27.73%14.05M | 33.82%13.28M | 33.82%13.28M | 94.45%11M |
| -Other payable | ---- | -0.26%1.29M | -0.26%1.29M | 5.45%1.36M | -35.67%1.29M | -35.67%1.29M | -22.51%1.29M | 140.62%2.01M | 140.62%2.01M | 169.17%1.66M |
| Other liabilities | 5.77%1.23B | 13.67%1.19B | 13.67%1.19B | 20.46%1.16B | 15.33%1.05B | 15.33%1.05B | 28.26%963.15M | 57.98%910.9M | 57.98%910.9M | 40.35%750.95M |
| Total liabilities | 6.07%1.25B | 14.89%1.24B | 14.89%1.24B | 20.16%1.18B | 16.65%1.08B | 16.65%1.08B | 28.00%981.48M | 56.66%926.98M | 56.66%926.98M | 39.80%766.76M |
| Shareholders'equity | ||||||||||
| Total stockholders'equity | 10.07%642.24M | -15.26%554.58M | -15.26%554.58M | -20.46%583.49M | -1.04%654.46M | -1.04%654.46M | 32.86%733.57M | 110.36%661.34M | 110.36%661.34M | 118.38%552.14M |
| Total equity | 10.07%642.24M | -15.26%554.58M | -15.26%554.58M | -20.46%583.49M | -1.04%654.46M | -1.04%654.46M | 32.86%733.57M | 110.36%661.34M | 110.36%661.34M | 118.38%552.14M |
| Accounting Standards | US-GAAP | US-GAAP | US-GAAP | US-GAAP | US-GAAP | US-GAAP | US-GAAP | US-GAAP | US-GAAP | US-GAAP |
| Audit Opinions | -- | Unqualified Opinion | -- | -- | Unqualified Opinion | -- | -- | Unqualified Opinion | -- | -- |
FY: Financial Year. Refers to the 10-K file disclosed by the listed company to the SEC.
Q: Quarter. Refers to the 10-Q file disclosed by the listed company to the SEC. Q1, Q2, Q3, and Q4 are quarterly reports each with a span of 3 months; Q6 and Q9 are cumulative reports, with Q6 including 6 months and Q9 9 months.
