Brookfield Renewable Partners LP
BEP.UN
The Toronto-Dominion Bank
TD
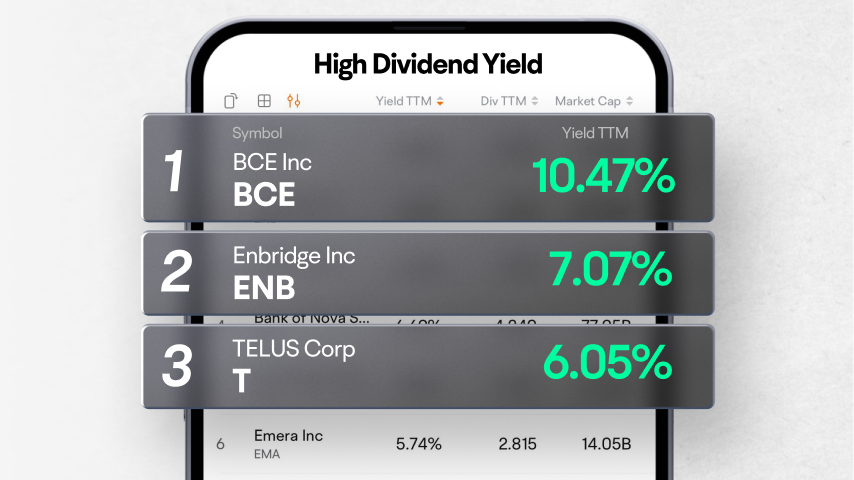
BCE Inc
BCE
TC Energy Corp
TRP
Enbridge Inc
ENB
| (Q3)Dec 31, 2022 | (Q2)Sep 30, 2022 | (Q1)Jun 30, 2022 | (FY)Mar 31, 2022 | (Q4)Mar 31, 2022 | (Q3)Dec 31, 2021 | (Q2)Sep 30, 2021 | (Q1)Jun 30, 2021 | |
|---|---|---|---|---|---|---|---|---|
| Operating Cash Flow (Indirect Method) | ||||||||
| Cash flow from continuing operating activities | 120.54%717 | 107.50%999 | 116.05%8.23K | -108.43K | -40.34K | -3.49K | -13.33K | -51.28K |
| Net income from continuing operations | -7,069.93%-140.67K | -520.29%-43.56K | 100.69%2.54K | ---425.95K | ---46.97K | ---1.96K | ---7.02K | ---370K |
| Remuneration paid in stock | --0 | --0 | --0 | --334.22K | --0 | --0 | --0 | --334.22K |
| Change In working capital | 9,347.29%141.39K | 807.00%44.56K | 136.70%5.69K | ---16.7K | --6.63K | ---1.53K | ---6.3K | ---15.5K |
| -Change in payables and accrued expense | 9,347.29%141.39K | 807.00%44.56K | 136.70%5.69K | ---16.7K | --6.63K | ---1.53K | ---6.3K | ---15.5K |
| Cash from discontinued investing activities | ||||||||
| Operating cash flow | 120.54%717 | 107.50%999 | 116.05%8.23K | ---108.43K | ---40.34K | ---3.49K | ---13.33K | ---51.28K |
| Investing cash flow | ||||||||
| Cash flow from continuing investing activities | ||||||||
| Cash from discontinued investing activities | ||||||||
| Financing cash flow | ||||||||
| Cash flow from continuing financing activities | 0 | 0 | 0 | 2.4M | 32K | 0 | -32K | 2.4M |
| Net common stock issuance | --0 | --0 | --0 | --2.4M | --32K | --0 | ---32K | --2.4M |
| Cash from discontinued financing activities | ||||||||
| Financing cash flow | --0 | --0 | --0 | --2.4M | --32K | --0 | ---32K | --2.4M |
| Net cash flow | ||||||||
| Beginning cash position | -0.08%3.3M | -1.46%3.3M | 229.33%3.29M | --1M | --3.3M | --3.31M | --3.35M | --1M |
| Current changes in cash | 120.54%717 | 102.20%999 | -99.65%8.23K | --2.29M | ---8.34K | ---3.49K | ---45.33K | --2.35M |
| End cash Position | 0.05%3.3M | -0.08%3.3M | -1.46%3.3M | --3.29M | --3.29M | --3.3M | --3.31M | --3.35M |
| Free cash from | 120.54%717 | 107.50%999 | 116.05%8.23K | ---108.43K | ---40.34K | ---3.49K | ---13.33K | ---51.28K |
| Accounting Standards | US-GAAP | US-GAAP | US-GAAP | US-GAAP | US-GAAP | US-GAAP | US-GAAP | US-GAAP |
| Audit Opinions | -- | -- | -- | Unqualified Opinion | -- | -- | -- | -- |
FY: Financial Year. Refers to the 10-K file disclosed by the listed company to the SEC.
Q: Quarter. Refers to the 10-Q file disclosed by the listed company to the SEC. Q1, Q2, Q3, and Q4 are quarterly reports each with a span of 3 months; Q6 and Q9 are cumulative reports, with Q6 including 6 months and Q9 9 months.
