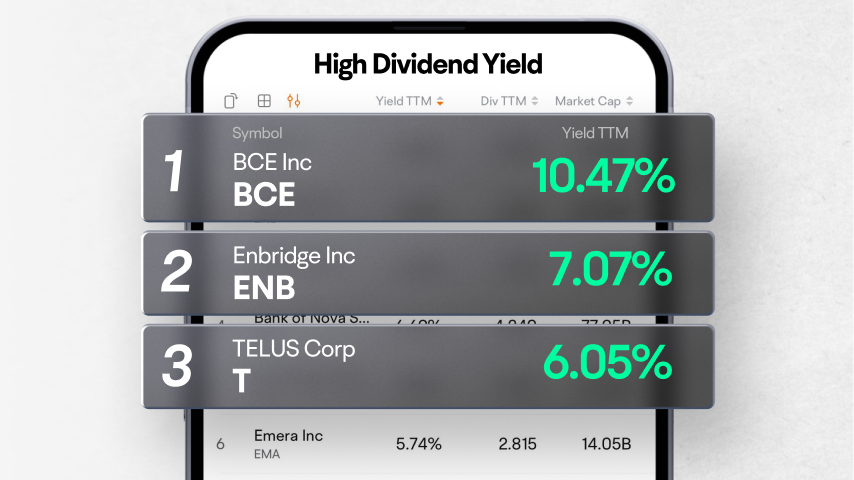
Bank of Nova Scotia
BNS
TC Energy Corp
TRP
The Toronto-Dominion Bank
TD
Power Corporation of Canada
POW
Choice Properties Real Estate Investment Trust
CHP.UN
| (Q3)Sep 30, 2024 | (Q2)Jun 30, 2024 | (Q1)Mar 31, 2024 | (FY)Dec 31, 2023 | (Q4)Dec 31, 2023 | (Q3)Sep 30, 2023 | (Q2)Jun 30, 2023 | (Q1)Mar 31, 2023 | (FY)Dec 31, 2022 | (Q4)Dec 31, 2022 | |
|---|---|---|---|---|---|---|---|---|---|---|
| Assets | ||||||||||
| Current assets | ||||||||||
| Cash, cash equivalents and short term investments | -71.69%3.65M | -57.56%5.86M | -38.52%9.07M | -28.28%11.22M | -28.28%11.22M | -20.93%12.89M | -23.16%13.81M | -26.02%14.76M | -27.76%15.64M | -27.76%15.64M |
| -Cash and cash equivalents | -71.69%3.65M | -57.56%5.86M | -38.52%9.07M | -28.28%11.22M | -28.28%11.22M | -20.93%12.89M | -23.16%13.81M | -26.02%14.76M | -27.76%15.64M | -27.76%15.64M |
| Receivables | 97.41%151.18K | 262.82%177.67K | 284.04%104.8K | 56.15%55.25K | 56.15%55.25K | 111.99%76.58K | -46.18%48.97K | -59.27%27.29K | -42.28%35.38K | -42.28%35.38K |
| -Accounts receivable | 97.41%151.18K | 262.82%177.67K | 284.04%104.8K | 56.15%55.25K | 56.15%55.25K | 111.99%76.58K | -46.18%48.97K | -59.27%27.29K | -42.28%35.38K | -42.28%35.38K |
| Prepaid assets | 319.02%444.61K | 585.01%873.56K | 162.55%302.11K | 78.63%163.13K | 78.63%163.13K | -64.62%106.11K | -56.07%127.53K | -52.70%115.07K | -27.23%91.32K | -27.23%91.32K |
| Total current assets | -67.53%4.24M | -50.58%6.91M | -36.38%9.48M | -27.48%11.43M | -27.48%11.43M | -21.43%13.07M | -23.80%13.99M | -26.45%14.9M | -27.80%15.77M | -27.80%15.77M |
| Non current assets | ||||||||||
| Net PPE | 128.14%19.16M | 1,905.53%19.06M | 645.74%7.34M | 604.58%7.15M | 604.58%7.15M | 674.72%8.4M | -12.22%950.36K | -12.25%984.38K | -10.39%1.02M | -10.39%1.02M |
| -Gross PPE | 124.47%19.55M | 1,464.86%19.42M | 509.87%7.67M | 489.73%7.48M | 489.73%7.48M | 568.64%8.71M | -2.39%1.24M | -2.73%1.26M | -0.60%1.27M | -0.60%1.27M |
| -Accumulated depreciation | -24.66%-384.72K | -24.01%-360.45K | -21.33%-332.15K | -27.57%-321.89K | -27.57%-321.89K | -41.47%-308.61K | -53.95%-290.66K | -59.56%-273.76K | -77.27%-252.32K | -77.27%-252.32K |
| Investments and advances | --1.91M | --2.07M | --2.1M | --2.11M | --2.11M | ---- | ---- | ---- | --0 | --0 |
| Non current accounts receivable | --891.53K | --228.01K | --76.09K | ---- | ---- | ---- | ---- | ---- | ---- | ---- |
| Due from related parties non current | --891.53K | --228.01K | --76.09K | ---- | ---- | ---- | ---- | ---- | ---- | ---- |
| Other non current assets | -11.83%65.59K | 3.60%68.74K | -2.57%66.45K | -2.12%67.76K | -2.12%67.76K | 28.30%74.39K | 14.31%66.35K | 11.57%68.2K | 15.21%69.22K | 15.21%69.22K |
| Total non current assets | 159.92%22.02M | 2,007.07%21.42M | 810.00%9.58M | 760.63%9.33M | 760.63%9.33M | 641.90%8.47M | -10.87%1.02M | -11.02%1.05M | -9.10%1.08M | -9.10%1.08M |
| Total assets | 21.92%26.27M | 88.82%28.34M | 19.46%19.06M | 23.25%20.77M | 23.25%20.77M | 21.18%21.55M | -23.04%15.01M | -25.60%15.95M | -26.83%16.85M | -26.83%16.85M |
| Liabilities | ||||||||||
| Current liabilities | ||||||||||
| Payables | 164.99%799.25K | --513.21K | 3.95%239.31K | 66.66%391.7K | 66.66%391.7K | --301.62K | ---- | --230.2K | --235.03K | --235.03K |
| -accounts payable | 351.94%687.05K | --402.64K | 34.59%223.81K | 31.29%128.91K | 31.29%128.91K | --152.02K | ---- | --166.29K | --98.19K | --98.19K |
| -Due to related parties current | -25.00%112.2K | --110.58K | -75.76%15.5K | 92.05%262.79K | 92.05%262.79K | --149.6K | ---- | --63.92K | --136.84K | --136.84K |
| Current deferred liabilities | --93.05K | --86.96K | --80.34K | --78.29K | --78.29K | ---- | ---- | ---- | --0 | --0 |
| Current liabilities | 195.84%892.3K | 151.91%600.17K | 38.85%319.65K | 99.97%470K | 99.97%470K | 43.17%301.62K | -42.80%238.25K | -58.26%230.2K | -40.15%235.03K | -40.15%235.03K |
| Non current liabilities | ||||||||||
| Total non current liabilities | --0 | --0 | --0 | --0 | --0 | --0 | --0 | --0 | --0 | --0 |
| Total liabilities | 195.84%892.3K | 151.91%600.17K | 38.85%319.65K | 99.97%470K | 99.97%470K | 43.17%301.62K | -42.80%238.25K | -58.26%230.2K | -40.15%235.03K | -40.15%235.03K |
| Shareholders'equity | ||||||||||
| Share capital | 25.94%59.7M | 47.47%59.57M | 19.88%48.43M | 19.88%48.43M | 19.88%48.43M | 17.33%47.4M | 0.00%40.4M | 0.56%40.4M | 0.56%40.4M | 0.56%40.4M |
| -common stock | 25.94%59.7M | 47.47%59.57M | 19.88%48.43M | 19.88%48.43M | 19.88%48.43M | 17.33%47.4M | 0.00%40.4M | 0.56%40.4M | 0.56%40.4M | 0.56%40.4M |
| Additional paid-in capital | 109.25%12.1M | 83.98%9.97M | 54.74%8.38M | 1.52%5.5M | 1.52%5.5M | 6.76%5.78M | 0.00%5.42M | -1.68%5.42M | -1.29%5.42M | -1.29%5.42M |
| Retained earnings | -45.54%-46.31M | -34.82%-41.71M | -26.60%-37.96M | -15.15%-33.54M | -15.15%-33.54M | -12.74%-31.82M | -15.80%-30.94M | -20.82%-29.99M | -26.33%-29.13M | -26.33%-29.13M |
| Gains losses not affecting retained earnings | 18.66%-96.9K | 16.78%-93.06K | -2.28%-107.34K | -25.62%-93.73K | -25.62%-93.73K | -467.59%-119.14K | -534.34%-111.83K | -511.55%-104.95K | -368.03%-74.61K | -368.03%-74.61K |
| Total stockholders'equity | 19.51%25.39M | 87.84%27.74M | 19.19%18.74M | 22.16%20.3M | 22.16%20.3M | 20.92%21.24M | -22.61%14.77M | -24.73%15.72M | -26.60%16.62M | -26.60%16.62M |
| Noncontrolling interests | ---13.27K | ---6.05K | ---2.13K | ---- | ---- | ---- | ---- | ---- | ---- | ---- |
| Total equity | 19.45%25.38M | 87.80%27.74M | 19.18%18.74M | 22.16%20.3M | 22.16%20.3M | 20.92%21.24M | -22.61%14.77M | -24.73%15.72M | -26.60%16.62M | -26.60%16.62M |
| Accounting Standards | US-GAAP | US-GAAP | US-GAAP | US-GAAP | US-GAAP | US-GAAP | US-GAAP | US-GAAP | US-GAAP | US-GAAP |
| Audit Opinions | -- | -- | -- | Unqualified Opinion with Explanatory Notes | -- | -- | -- | -- | Unqualified Opinion | -- |
FY: Financial Year. Refers to the 10-K file disclosed by the listed company to the SEC.
Q: Quarter. Refers to the 10-Q file disclosed by the listed company to the SEC. Q1, Q2, Q3, and Q4 are quarterly reports each with a span of 3 months; Q6 and Q9 are cumulative reports, with Q6 including 6 months and Q9 9 months.
