Power Corporation of Canada
POW
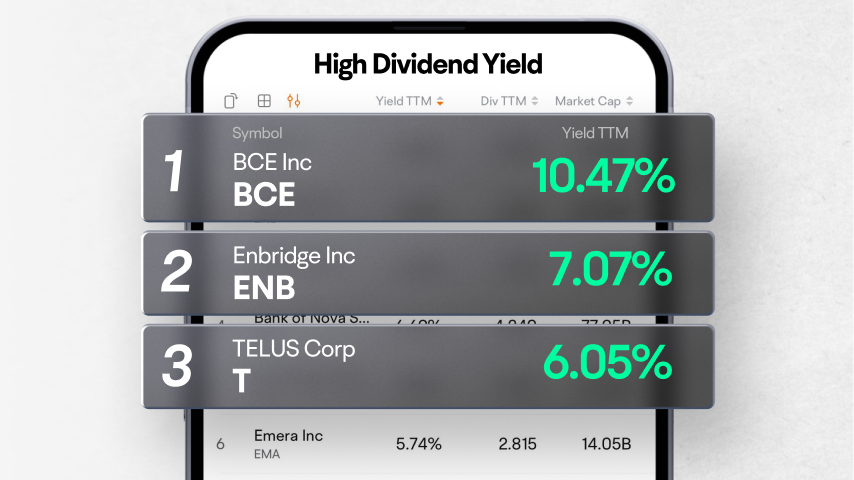
Choice Properties Real Estate Investment Trust
CHP.UN
Bank of Nova Scotia
BNS
Enbridge Inc
ENB
TC Energy Corp
TRP
| (Q3)May 31, 2024 | (Q2)Feb 29, 2024 | (Q1)Nov 30, 2023 | (FY)Aug 31, 2023 | |
|---|---|---|---|---|
| Assets | ||||
| Current assets | ||||
| Cash, cash equivalents and short term investments | --2.82M | --404.44K | --574.43K | --654.24K |
| -Cash and cash equivalents | --2.82M | --404.44K | --574.43K | --654.24K |
| Prepaid assets | --148.28K | --5K | ---- | ---- |
| Total current assets | --2.96M | --409.44K | --574.43K | --654.24K |
| Non current assets | ||||
| Net PPE | --568.73K | --189.12K | --29.79K | --29.13K |
| Total non current assets | --568.73K | --189.12K | --29.79K | --29.13K |
| Total assets | --3.53M | --598.56K | --604.21K | --683.36K |
| Liabilities | ||||
| Current liabilities | ||||
| Payables | --90.95K | --54.85K | --26.78K | --23.47K |
| -accounts payable | --90.44K | --54.06K | --25.99K | --12.37K |
| -Due to related parties current | --509 | --790 | --790 | --11.11K |
| Other current liabilities | --1.1K | --6.87K | ---- | ---- |
| Current liabilities | --92.05K | --61.72K | --26.78K | --23.47K |
| Non current liabilities | ||||
| Total non current liabilities | --0 | --0 | --0 | --0 |
| Total liabilities | --92.05K | --61.72K | --26.78K | --23.47K |
| Shareholders'equity | ||||
| Share capital | --4.45M | --1.03M | --393.72K | --395.17K |
| -common stock | --4.45M | --1.03M | --393.72K | --395.17K |
| Retained earnings | ---2.07M | ---493.12K | ---95.59K | ---14.58K |
| Gains losses not affecting retained earnings | --1.06M | ---- | ---- | ---- |
| Other equity interest | ---- | ---- | --279.3K | --279.3K |
| Total stockholders'equity | --3.44M | --536.84K | --577.43K | --659.89K |
| Total equity | --3.44M | --536.84K | --577.43K | --659.89K |
| Accounting Standards | US-GAAP | US-GAAP | US-GAAP | US-GAAP |
FY: Financial Year. Refers to the 10-K file disclosed by the listed company to the SEC.
Q: Quarter. Refers to the 10-Q file disclosed by the listed company to the SEC. Q1, Q2, Q3, and Q4 are quarterly reports each with a span of 3 months; Q6 and Q9 are cumulative reports, with Q6 including 6 months and Q9 9 months.
