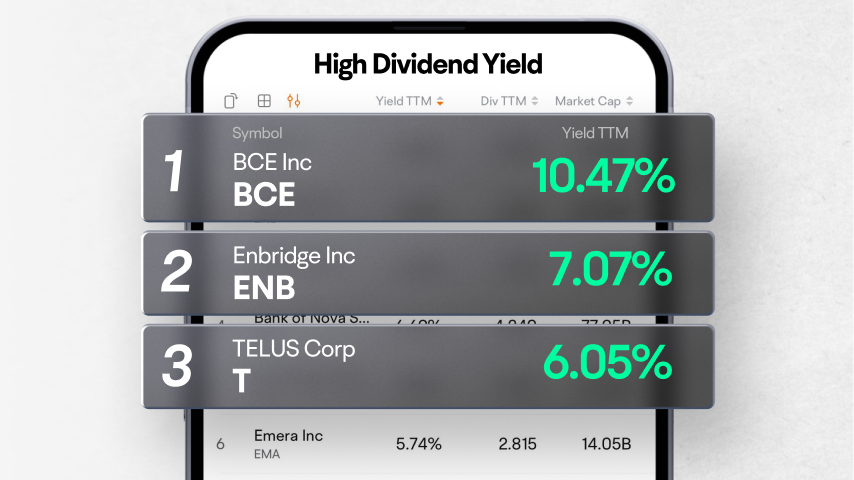
Enbridge Inc
ENB
TC Energy Corp
TRP
Bank of Nova Scotia
BNS
The Toronto-Dominion Bank
TD
Power Corporation of Canada
POW
| (FY)Dec 31, 2023 | (FY)Dec 31, 2022 | (FY)Dec 31, 2021 | (FY)Dec 31, 2020 | (FY)Dec 31, 2019 | (FY)Dec 31, 2018 | (FY)Dec 31, 2017 | (FY)Dec 31, 2016 | (FY)Dec 31, 2015 | (FY)Dec 31, 2014 | |
|---|---|---|---|---|---|---|---|---|---|---|
| Operating cash flow (Indirect Method) | ||||||||||
| Cash flow from continuing operating activities | ||||||||||
| Net income from continuing operations | 125.53%13.8M | -157.63%-54.06M | 4,265.16%93.81M | -90.48%2.15M | 210.88%22.57M | -201.99%-20.36M | -45.42%19.96M | 394.82%36.57M | -165.66%-12.4M | -26.23%18.89M |
| Other non cashItems | 2,176.11%4.79M | 68.67%210.61K | 561.00%124.86K | --18.89K | ---- | ---- | 21.40%-37.93K | 10.60%-48.25K | -12.17%-53.98K | 0.00%-48.12K |
| Change in working capital | -41.30%521.1K | 260.35%887.74K | -270.36%-553.62K | -0.21%324.97K | 699.56%325.64K | -135.95%-54.31K | 1,778.09%151.08K | 97.59%-9K | -1,361.62%-373.96K | -258.88%-25.59K |
| -Change in receivables | -152.06%-198.61K | 146.85%381.47K | -195.10%-814.32K | -232.33%-275.94K | 429.97%208.52K | -121.64%-63.19K | -3.67%-28.51K | 90.13%-27.5K | -3,549.96%-278.57K | -103.43%-7.63K |
| -Change in prepaid assets | -2,240.60%-75.76K | 18.96%3.54K | -84.74%2.98K | 134.85%19.5K | ---55.94K | --0 | ---- | ---- | ---- | ---- |
| -Change in other current liabilities | --0 | --0 | --0 | --0 | --0 | --0 | --0 | --0 | --0 | --0 |
| Cash from discontinued operating activities | ||||||||||
| Operating cash flow | 32.88%-23.23M | -580.07%-34.61M | 108.67%7.21M | -689.45%-83.16M | -254.43%-10.53M | 255.60%6.82M | -83.61%1.92M | -36.70%11.7M | 70.08%18.49M | 22.18%10.87M |
| Investing cash flow | ||||||||||
| Cash flow from continuing investing activities | ||||||||||
| Cash from discontinued investing activities | ||||||||||
| Financing cash flow | ||||||||||
| Cash flow from continuing financing activities | ||||||||||
| Net commonstock issuance | -10.91%29.4M | 341.36%33M | -126.70%-13.67M | 335.12%51.21M | --11.77M | --0 | 16.05%-1.87M | 60.27%-2.23M | -359.28%-5.61M | -5,971.46%-1.22M |
| Net preferred stock issuance | 11.05%25.54M | -0.18%23M | -51.84%23.04M | 450.89%47.84M | --8.69M | --0 | 895.14%12.41M | 64.82%-1.56M | -481.29%-4.44M | ---762.99K |
| Cash dividends paid | -19.38%-23.92M | -24.21%-20.04M | -16.27%-16.13M | -36.22%-13.88M | -8.31%-10.19M | -4.56%-9.41M | -11.40%-8.99M | 5.86%-8.07M | 1.47%-8.58M | 0.09%-8.71M |
| Net other financing activities | --0 | --0 | 103.86%86.59K | ---2.24M | --0 | --0 | --0 | --0 | --0 | --0 |
| Cash from discontinued financing activities | ||||||||||
| Financing cash flow | -13.22%29.93M | 616.60%34.49M | -108.05%-6.68M | 757.72%82.93M | 202.80%9.67M | -709.31%-9.41M | 113.01%1.54M | 36.28%-11.86M | -74.18%-18.62M | -22.97%-10.69M |
| Net cash flow | ||||||||||
| Beginning cash position | -19.69%475.05K | 897.48%591.49K | -79.55%59.3K | -74.90%289.97K | -69.10%1.16M | 1,247.44%3.74M | -36.53%277.52K | -22.78%437.24K | 47.37%566.22K | 114.27%384.21K |
| Current changes in cash | 5,856.11%6.7M | -121.88%-116.44K | 330.71%532.19K | 73.34%-230.67K | 66.51%-865.34K | -174.64%-2.58M | 2,267.47%3.46M | -23.83%-159.72K | -170.86%-128.98K | -11.17%182.01K |
| End cash position | 1,410.82%7.18M | -19.69%475.05K | 897.48%591.49K | -79.55%59.3K | -74.90%289.97K | -69.10%1.16M | 1,247.44%3.74M | -36.53%277.52K | -22.78%437.24K | 47.37%566.22K |
| Free cash from | 32.88%-23.23M | -580.07%-34.61M | 108.67%7.21M | -689.45%-83.16M | -254.43%-10.53M | 255.60%6.82M | -83.61%1.92M | -36.70%11.7M | 70.08%18.49M | 22.18%10.87M |
| Accounting Standards | US-GAAP | US-GAAP | US-GAAP | US-GAAP | US-GAAP | US-GAAP | US-GAAP | US-GAAP | US-GAAP | US-GAAP |
| Audit Opinions | Unqualified Opinion | Unqualified Opinion | Unqualified Opinion | Unqualified Opinion | Unqualified Opinion | Unqualified Opinion | Unqualified Opinion | Unqualified Opinion | Unqualified Opinion | Unqualified Opinion |
FY: Financial Year. Refers to the 10-K file disclosed by the listed company to the SEC.
Q: Quarter. Refers to the 10-Q file disclosed by the listed company to the SEC. Q1, Q2, Q3, and Q4 are quarterly reports each with a span of 3 months; Q6 and Q9 are cumulative reports, with Q6 including 6 months and Q9 9 months.
